
Electric Vehicles and Clean Energy
Electric Motor versus Internal Combustion Engine
As automotive engineers, we are interested in E-mobility and how to combine it with clean energy. Let us look at an example, where we consider replacing a VW Golf with a Tesla Model 3.
The VW Golf (*1) has a WLTP combined fuel consumption of 5.6 ltr/100 km. With a specific energy density for gasoline of 8.9 kWh/ltr the corresponding primary energy consumption is 49.8 kWh/100km. As an average driver in Germany drives about 15000 km/a (per year), she needs 840 ltr gasoline and generates 2000 kg of CO2. Her car's annual primary energy consumption is approximately 7500 kWh/a.
Note: Experience shows, that real-world consumption is 10 ... 30% higher than the WLTP values, as the WLTP test conditions are somewhat artificial. But let's be optimistic and stick with the WLTP data.
The Tesla Model 3 (*2) has a WLTP consumption of 14.0 kWh/100 km. With the same driving distance as above, its annual electric energy consumption is 2100 kWh/a. We can see that the ICE has an energy efficiency of only 0.28 (=2100/7500) compared to the electric drive. Combined with the fact that the electric drive has zero local CO2 emissions, this approximately 3 times higher energy efficiency is the main advantage of E-mobility.
However, while fossil fuels can be considered primary energy, electric energy must be generated from other energy sources. So how do we charge our Tesla?
Nuclear Power?
For the individual car owner a private nuclear power plant to charge her car is not an option. But for a whole country it is a possible solution. If all 48 million passenger cars in Germany, most of which are still ICE-powered, were replaced by Tesla Model 3s, the required electrical energy would be 48 million · 2100 kWh/a = 100 800 GWh/a = 100.8 TWh/a per year. Each of the few remaining nuclear power plants in Germany produces about 11.5 TWh/a (data for 2020). Whether you like the idea or not, 9 of them would do the job ... But if you want "real clean energy", we have to find another solution.
Solar panels?
According to (*3) an optimally positioned solar panel converts the 1 kWp/m2 peak power, which the sun delivers theoretically on a sunny summer day at noon, into a theoretical Ppeak,solar= 0.2 kWp/m2, i.e. commercial solar panels plus inverter have a total efficiency of about 20%. It is this peak power Ppeak,solar, for which we have to design the electric components of the system. And it is this value which is frequently reported as "installed power".
But peak is not average and power is not energy! Due to the daily rise and dawn of the sun and the seasonal cycle of summer and winter, as we move away from the equator, the average is much smaller (Figure 1). E.g. in southern Germany on a sunny winter at noon, we only get one third of the summer's peak power. The daily energy is even more sensitive, as in summer daylight lasts for up to 16 hours, while during winter it may be as short as 8 hours. And then we have the weather: clouds, rain and snow. All these effects drastically reduce the total available energy in each month (Figure 1).
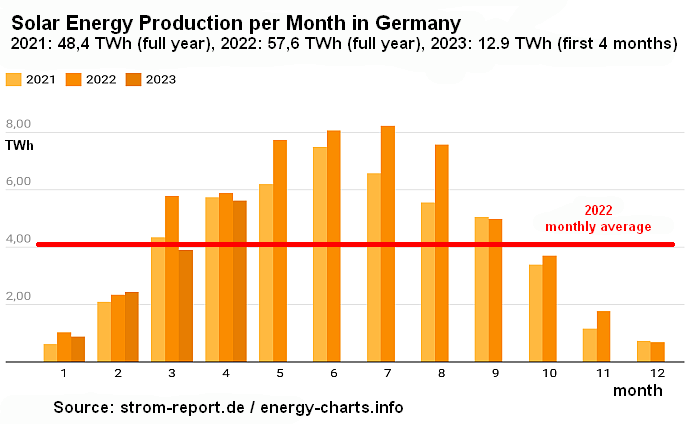
For my hometown (Stuttgart, Germany) over a year an average reduction factor of 0.136 was measured (*3), i.e. the annual effective power (*9) is Peff,solar= 0.136 Ppeak,solar . Thus, our solar panel provides a total energy of about Esolar= Peff,solar · 365 d/a · 24 h/d = 240 kWh/(m2 a) per year. However, the annual values may be a bit misleading. As Figure 1 shows, there is a strong monthly variation in the total solar production of Germany (Figure 1). During the best summer months, we may produce more than double (2x) the average, while during the worst winter months, we may have less than a quarter (0.25x) of the average.
If the panel is not in the optimal position, the energy will be further reduced (*4). E.g. if the panels point to the east or west rather than south, we lose 20%. If the panel is mounted vertically rather than with the optimal 30° ... 45° inclination, we lose another 30%. Assuming a slightly suboptimal position, let's continue with Esolar= 200 kWh/(m2 a) per year.
Now back to our Tesla Model 3 example. If we want to generate all of the required 2100 kWh/a, we would need a solar panel with 2100 kWh/a / 200 kWh/(m2 a) = 10.5 m2. No big problem, if you can use the roof or your garage or house. A bit too much, if you have to place the solar panel on the balcony of your rented apartment.
However, this calculation cares only about balancing the averages, forgetting that electric energy production and consumption must be balanced not only on average but at any moment unless someone provides an intermediate storage for the energy. Without that, you'd better drive during the night only, because during daylight you have to charge your car. And you should prefer driving during the summer season and staying at home in winter, as the bulk of the solar energy is generated in summer (Figure 1). Averaging electrical energy over the daily cycle should not be a problem for your grid operator, as there are a lot of other consumers during the day, while during the night some nuclear or fossil power plants may have excess capacity to charge electric vehicles. The summer/winter seasonality however cannot be averaged, as a lot of other consumers also need more energy in winter than summer. Balancing between the northern and the southern hemispheres, where seasonality is inverse to each other, seems far from realistic. Thus, we may need to oversize our solar panels by a factor 1/0.25 = 4 or more to have enough energy even in January and December. Now our solar panel size has increased to 40 m2. And we have not yet discussed the cars of your spouse and all the other electric consumers at home. Hm.
Wind energy?
According to (*3, *5) the power P ~ d2 v3 of a wind turbine is proportional to the diameter d of the rotor blades squared and to the third power of the wind speed v. A turbine with a diameter d = 2 m, which you could mount on top of your roof, at a gentle breeze of 4 m/s (8 knots), which is the average wind speed reported for the German countryside, and an efficiency of 50%, which is close to the theoretical limit, would generate P ≈ 60 W. Enough to power your notebook, but not to charge your Tesla.
Thus, having your own wind turbine at home does not solve the problem. Better we use much larger rotor diameters and install them on top of mountains or at the coast, where wind speeds are higher and more reliable. A turbine with a rotor diameter of 120 m at 6 m/s could generate some Ppeak,wind= 750 kW. Such values for average or - even more misleading - for maximum wind speed are frequently reported as "installed power" Ppeak,wind and again are close to useless. What we are interested in is how much energy this wind turbine really generates.
Simply using the power for the average wind speed and multiplying it by 1a = 8760h to calculate the annual energy does not work, because P is highly nonlinear with respect to v and v is very volatile. Similar to solar panels, where we need the time profile of the local sunshine, we need the profile v(t) of the local wind speed over a year and then average P(v(t)). For several commercial German onshore wind farms annual effective power (*9) was reported to be Peff,wind ≈ 0.25 Ppeak,wind, while offshore wind farms achieved Peff,wind ≈ 0.5 Ppeak,wind. The annual energy Ewind= Peff,wind · 8760 h/a is in the range of 8 to 10 GWh/a per onshore wind turbine (diameters normalized to 120 m). Offshore wind farms provide 15 to 20 GWh/a per turbine, indicating the higher wind speeds on sea.
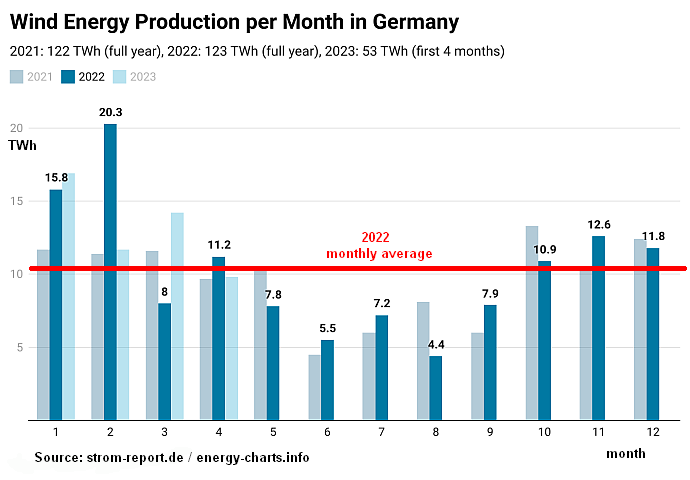
Again there is a strong seasonal cycle (Figure 2). In Germany, we may have double (2x) the monthly average in winter months, while less than half (0.5x) the average in summer months. This profile is nearly invers to the solar profile, where most of the energy is generated in summer. Thus, combining sun and wind helps to reduce our seasonal balancing problem.
Do we have enough space?
Let's calculate the specific area requirements first. For solar panels, we got 200 kWh/(m2 a). When mounted on a flat surface rather than on an inclined roof, we need some space between the panels to avoid shadowing. 100 to 150 kWh/(m2 a) seem more realistic for larger solar parks. Wind parks also need a lot of space. As the turbulences caused by one turbine influence its neighbors, turbines are typically installed in a chessboard pattern with an area of 4 times or more the rotor diameter squared per turbine. The 10 to 20 GWh/a for wind parks lead to 50 to 100 kWh/(m2 a), i.e. the same order of magnitude as for solar farms.
Again ignoring any daily and seasonal balancing problems and using an optimistic 100 kWh/(m2 a), the 100.8 TWh/a electrical energy for our fleet of 48 million Tesla Model 3s could be generated by solar and/or wind farms with a total area of some 1000 km2. Assuming that it takes 6 · 2.5 m2 to park a single Model 3, i.e. some 720 km2 for all 48 million cars, we could even park them all directly below these solar panels and wind turbines. Well, maybe not below those offshore wind turbines ...
BTW, the energy for our fleet of electric cars would increase Germany's consumption of electric energy by close to 20%, as in the last 10 years Germany's annual electrical energy production was 575 ... 650 TWh/a (*6, *7). To put that in perspective, Germany's annual primary energy consumption in the pre-COVID years was 13 ... 14 Exajoule/a, i.e. 3600 ... 3900 TWh/a. A bit more than one quarter is used for transport (cars, trucks, ...), a similar amount goes to households (heating, cooking, ...) and the remaining 45% are used for industry and all other sorts of economic activities (production, commerce, services, ...).
Final words
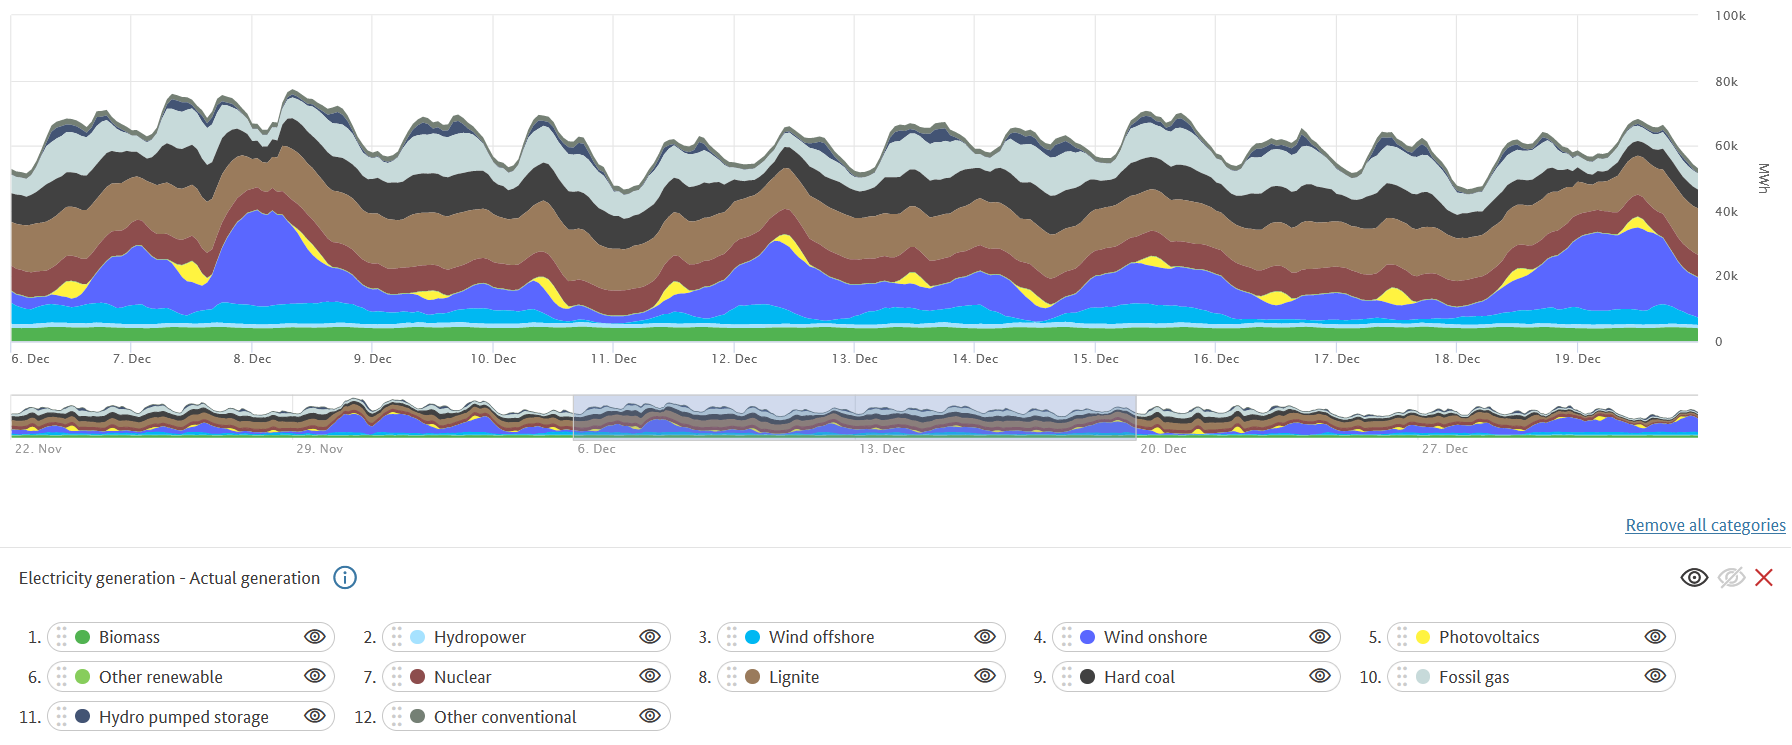
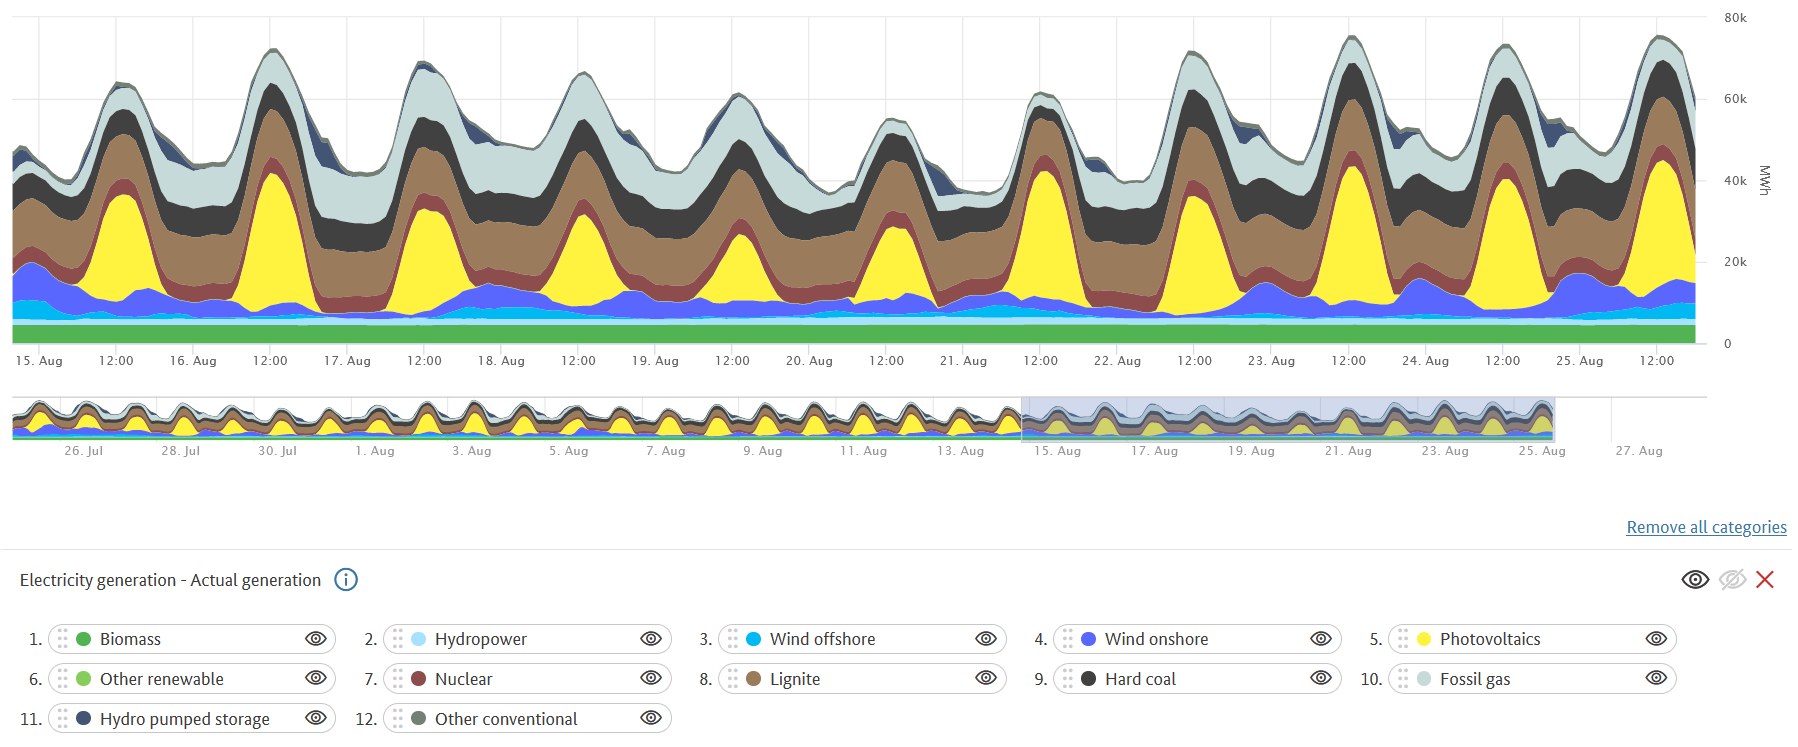
The balancing problem between power generation and power consumption remains. Solar and wind are extremely volatile and do not care about when consumers need energy. Even if the right combination of solar and wind and a considerable amount of oversizing may help with the seasonal problem, the daily variability remains to be solved. Every night there is no solar energy and if we have cloudy, but calm weather we may have a stretch of several days without any solar and wind energy at all. So we either need intermediate storage, which is not feasible on a large scale (see also below), or we must keep nuclear and/or fossil fuel power plants to smooth out the stochastic behavior of sun and wind (Figure 3 (*8)). The latter is not only costly but also one of the reasons for Germany's dependence on (Russian) natural gas. And may remain so for the foreseeable future, unless Germany reverses its decision to shut down even more of its nuclear, coal and oil power plants as it goes "green". Hm.
If you want to learn a bit more about the economic and technical problems with Germany's approach to "going green" with its electricity grid, you can watch this Youtube video (starts at 56:15min, sorry, only in German, try to enable subtitles).
When it comes to climate change, renewable energy and related issues, discussions tend to be emotional. Often, because opinions are exchanged rather than facts. Alarming news shall catch your attention rather than inform you. NGOs may seek more funding and justify their own existence rather than provide more insight. So-called experts expressing strong opinions on TV talk shows may want you to follow someone's agenda rather than enlighten you. And politicians may want to get reelected by comforting or by scaring you, but expect no real problem-solving if that would take more than one election period.
When in doubt - and you always should be - use your common sense, combine it with some basic high school math and physics and some data, for which you can easily find reliable sources on the Internet, if you do a little searching. Sure, developing such complex systems takes hard work and more knowledge and skill than most of us have. But often it does not take much to do some rule-of-thumb quantitative analysis and draw your own conclusions about whether something makes sense or is just wishful thinking.
One last example, of how easy that can be: What about the idea, to use the combined batteries of our electric vehicles to solve the intermediate storage problem for an all- wind, all-solar power grid? If our 48 million Teslas with their 60 kWh battery capacity (*12) were to feed the Germany power grid, their combined electrical energy would be about 2.9 TWh, hoping that they are all fully charged. Since Germany consumes 650 TWh/a of electrical energy, the Teslas could power Germany for about 2.9 TWh / 650 TWh/a = 0.0045 a = 1.6 days. Not bad, but what if the calm cloudy weather lasts a bit longer, if 48 million fully charged Teslas are unlikely, or - heaven forbid - if owners use their cars for driving instead? Looks like we'd better have some backup power sources with different technologies ...
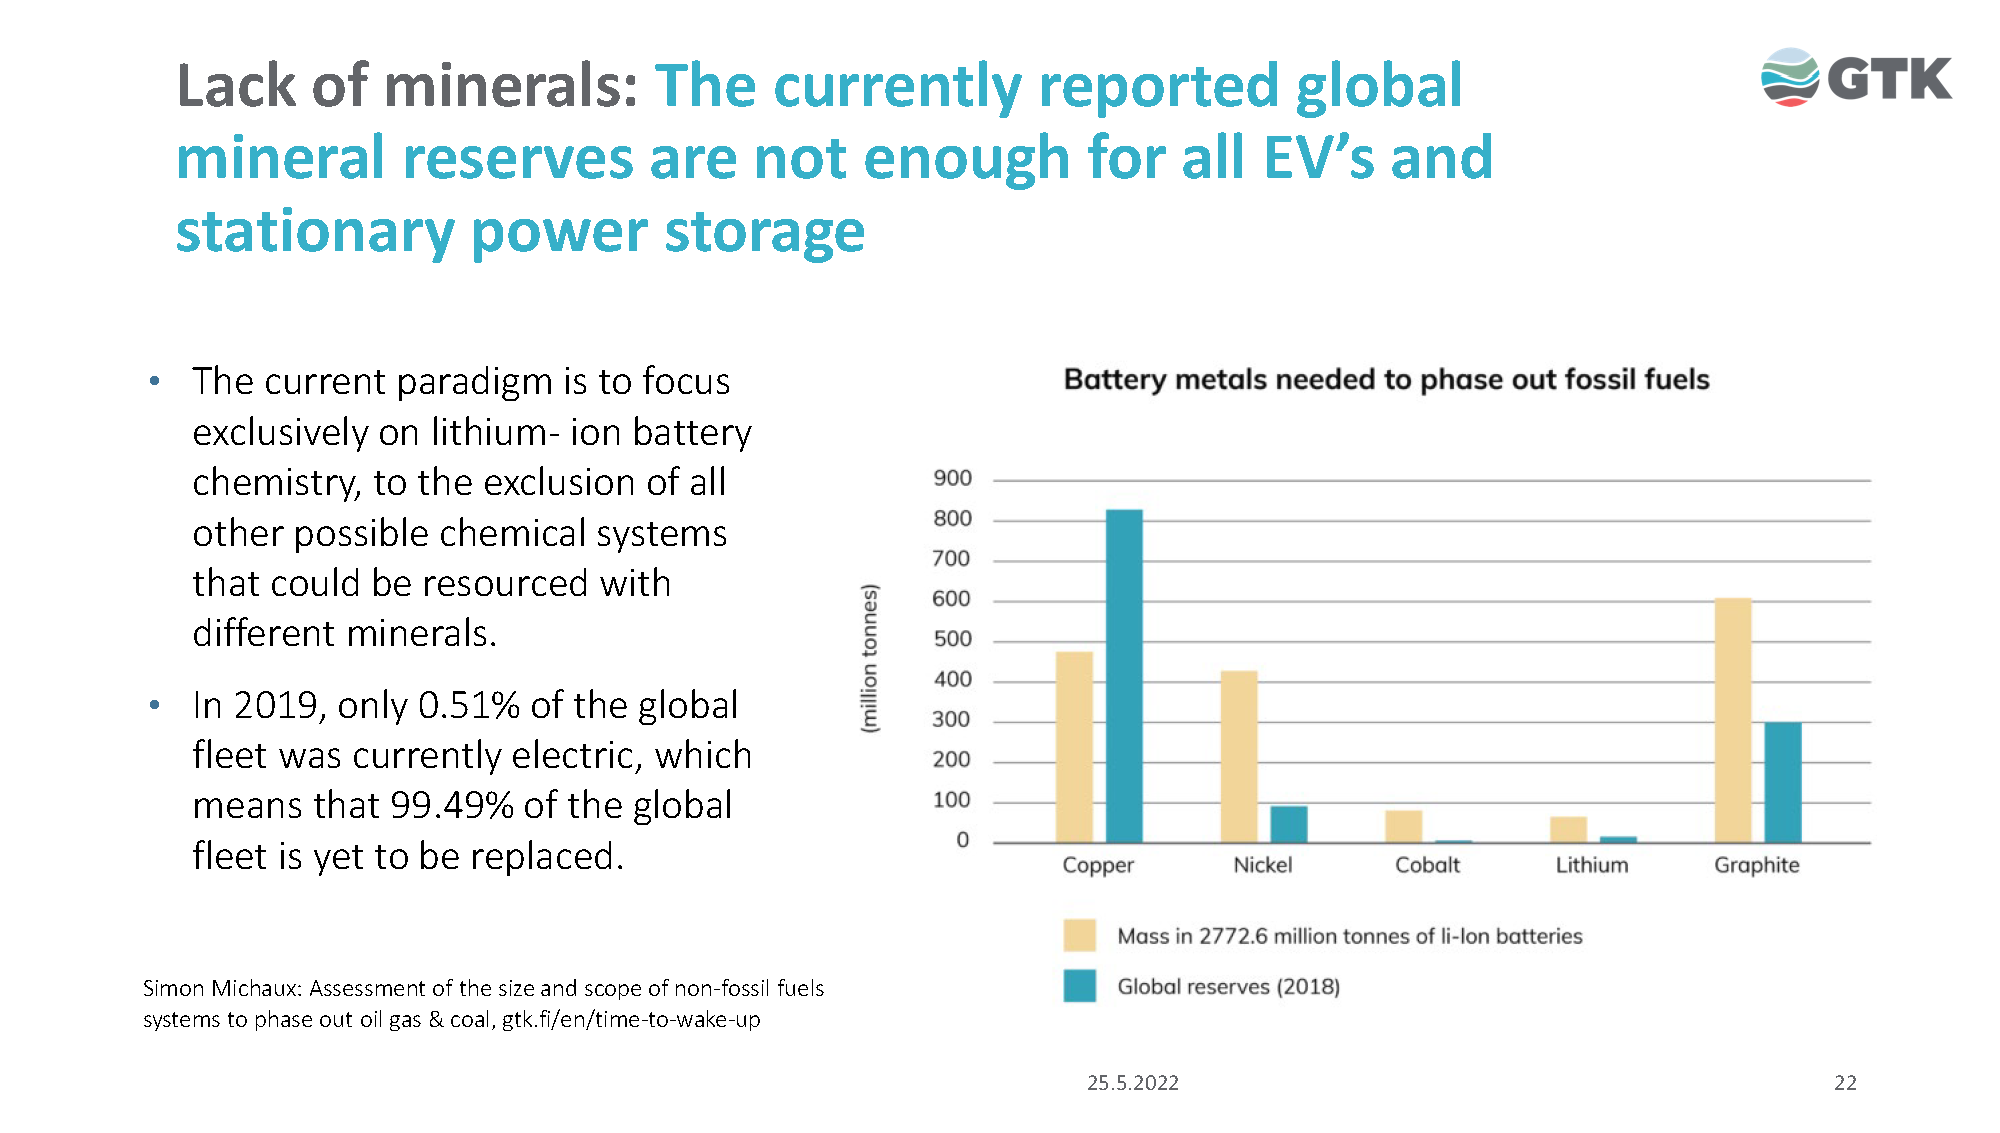
Want to dive deeper? Why not try to figure out, if we have enough lithium, cobalt, nickel or copper to build all those batteries and how the energy required to mine and produce batteries compares to the potential energy savings of electric vehicles. Figure 4 from (*13) or the video below are a good place to start. And if you are interested in geopolitics, see if you like the countries, where these materials can be mined (*14 - 18), more than the countries, where we get our fossil fuels from ...
- Mark Mills, Manhattan Institute
Related Posts
Acknowledgments
Most of the renewable energy information has been taken from reference (*3), while (*6) proved to be a brilliant source for all sorts of energy-related data. All errors in the above calculations and all opinions expressed are mine - and subject to change, if the facts change.
References
(*1) VW Golf 8, model year 2022, 1.5l TSI OPF 110 kW gasoline engine, front-wheel drive, manual transmission, see here and here (checked 2022-07-26)
(*2) Tesla Model 3, Europe version, model year 2022, single PSM motor with 88 kW average / 239 kW peak power, rear-wheel drive, 60 kWh battery package, see here and here (checked 2022-07-26)
(*3) C.Holler, J.Gaukel: Erneuerbare Energien - Ohne heisse Luft, Oekum, 2018, based on the book of the late David MacKay: Sustainable Energy - Without the Hot Air, 2015
(*5) Wind turbine power \(P = \frac{1}{2} \cdot \eta \cdot \rho \cdot \pi \cdot (\frac{d}{2})^2 \cdot v^3\) with efficiency \(\eta \), air density \(\rho = 1.25 kg/m^3\), rotor diameter \(d\) and wind speed \(v\)
(*6) BP: Statistical Review of World Energy, 2022
(*7) Umweltbundesamt: Energieverbrauch nach Energieträgern und Sektoren and Umweltbundesamt: Primärenergieverbrauch (checked 2022-08-06)
(*8) Bundesnetzagentur: Actual Electricity Production by Source for Germany (Note: set the time range as needed)
(*9) Electrical engineers will notice, that the effective power Peff relates to the peak power Ppeak in a similar way as the RMS value of an AC signal to its amplitude. The "effective value" represents the time variable AC signal by a constant DC value, which has the same effect (power/energy) averaged over a certain time period.
(*10) Wood as renewable energy? Forests in Germany produce some 10 m3/ (10000m2 a) of wood. With a specific weight of 625 kg/m3 and a specific energy of 4 kWh/kg (average values for different sorts of wood with 20% or less water content), our wood contains a primary energy of 2.5 kWh/(m2 a). With a conventional thermal power plant with a best-case efficiency of about 40% this could be converted into some 1 kWh/(m2 a) of electric energy (neglecting the energy required to cultivate the forest and cut the wood), i.e. two orders of magnitude less than wind or solar farms. If you intend to completely power your Tesla by this "wood electricity", you should consider purchasing some 2100 m2 of forest. Note: Germany has about 1300 m2 per person or 2400 m2 per car. Sources: here, here and here.
(*11) Plants as an alternative form of solar farms? Wheat, corn, oilseed rape or other plants transform solar energy into biomass. Rather than eating or feeding these plants, they can be converted into biofuel or biogas. According to (*3), the respective annual primary energy would be in the range of 1 ... 5 kWh/(m2 a), again neglecting the energy required to grow and process the plants.
(*12) State-of-the-art Lithium Ion batteries for electric vehicles have a specific weight of 5 kg/kWh = 1 kg/ltr and a lifetime of 2000 ... 4000 charging cycles. End of life is defined as losing more than 20% of the initial capacity.
(*13) S. P. Michaud: Assessment of the Extra Capacity Required of Alternative Energy Electrical Power Systems to Completely Replace Fossil Fuels, 2021, (full report, summary slides)
(*14) Visual Capitalist: The EV Mineral Shortage
(*15) Visual Capitalist: Cost Structure of EV Batteries
(*16) KGP Auto’s Powertrain Outlook Report
(*17) US Department of Energy: Critical Material Assessment 2023
(*18) IMF Working Paper No. 2023/201
If you have any comments, click here.